-
Title
-
GeoViewr
-
Creator
-
Zolotas, Rigas
-
Abstract
-
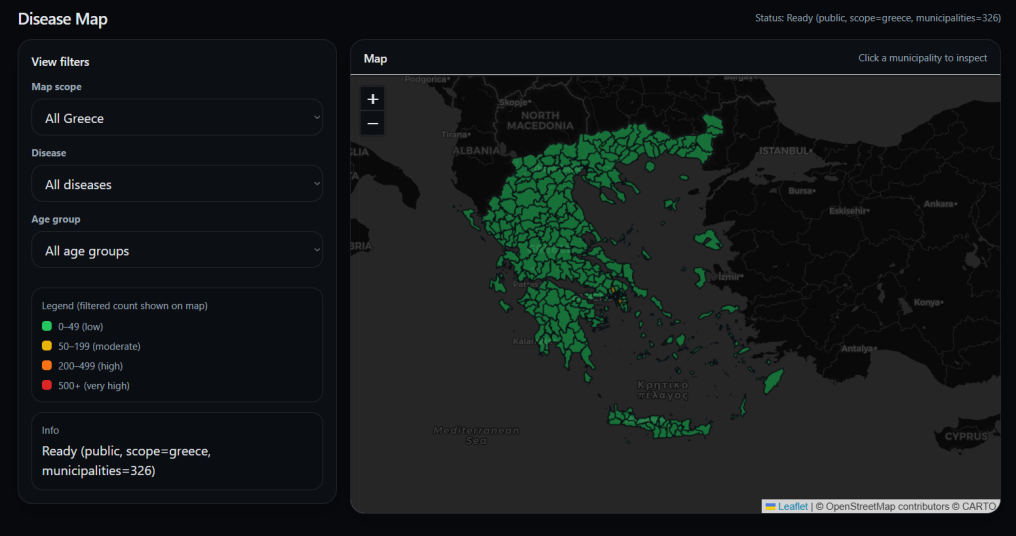
This project, in its current state, is a disease-visualization program designed to improve transparency on how diseases spread. It uses a map of Greece’s municipalities, color-coded by case levels (green: 0–49, yellow: 50–199, orange: 200–499, red: 500+). Each report includes disease-id, age-group (0–18 / 19–64 / 65+), municipality and doctor-id. The system has three user types: public (view data), doctor (submit reports) and admin/dev (manage doctor accounts and disease types). It allows municipalities to make informed decisions and helps detect patterns to prevent wider outbreaks, while also being adaptable to other countries and datasets.
-
Keywords
-
data-visualisation
-
public-health
-
decision-making
-
Subject
-
interdisciplinary
-
Date Available
-
May 28, 2026
-
Type
-
Website
-
Web application
-
Course
-
HSS 2225 Innovation in Action
-
Course Offering Term
-
Spring semester 2026
-
Instructor
-
Makris, Dimitris
-
Session
-
Honors Creative Projects
-
Location
-
Student Lounge
-
Event
-
Year 2026 | 10th Annual Student Research and Creative Arts Symposium